The centre, not the clock
A childcare group with nine centres keeps every enquiry in a SharePoint list. A parent fills in the web form or rings a centre, a row appears, and the centre director moves it along: Pending, Voicemail, Tour Booked, Tour Complete, Enrolled, Waitlist, Cancelled.
I’ve been writing their monthly enrolment report off that list since December. It pulls the list over Microsoft Graph, works out the funnel and which families have gone quiet, and turns it into a PDF for head office. A monthly report sees one month at a time.
This week I was getting ready to move the list into a proper system, so first I exported all of it: 1,440 enquiries, September 2024 to now. Twenty-two months is enough to ask a question a monthly report can’t. What actually turns an enquiry into an enrolment?
The finding I wanted
In childcare, the tour is the moment that decides it. A family walks through the rooms, meets the educators, and makes up their mind. So I lined up every tour that had a date against the day the enquiry came in.
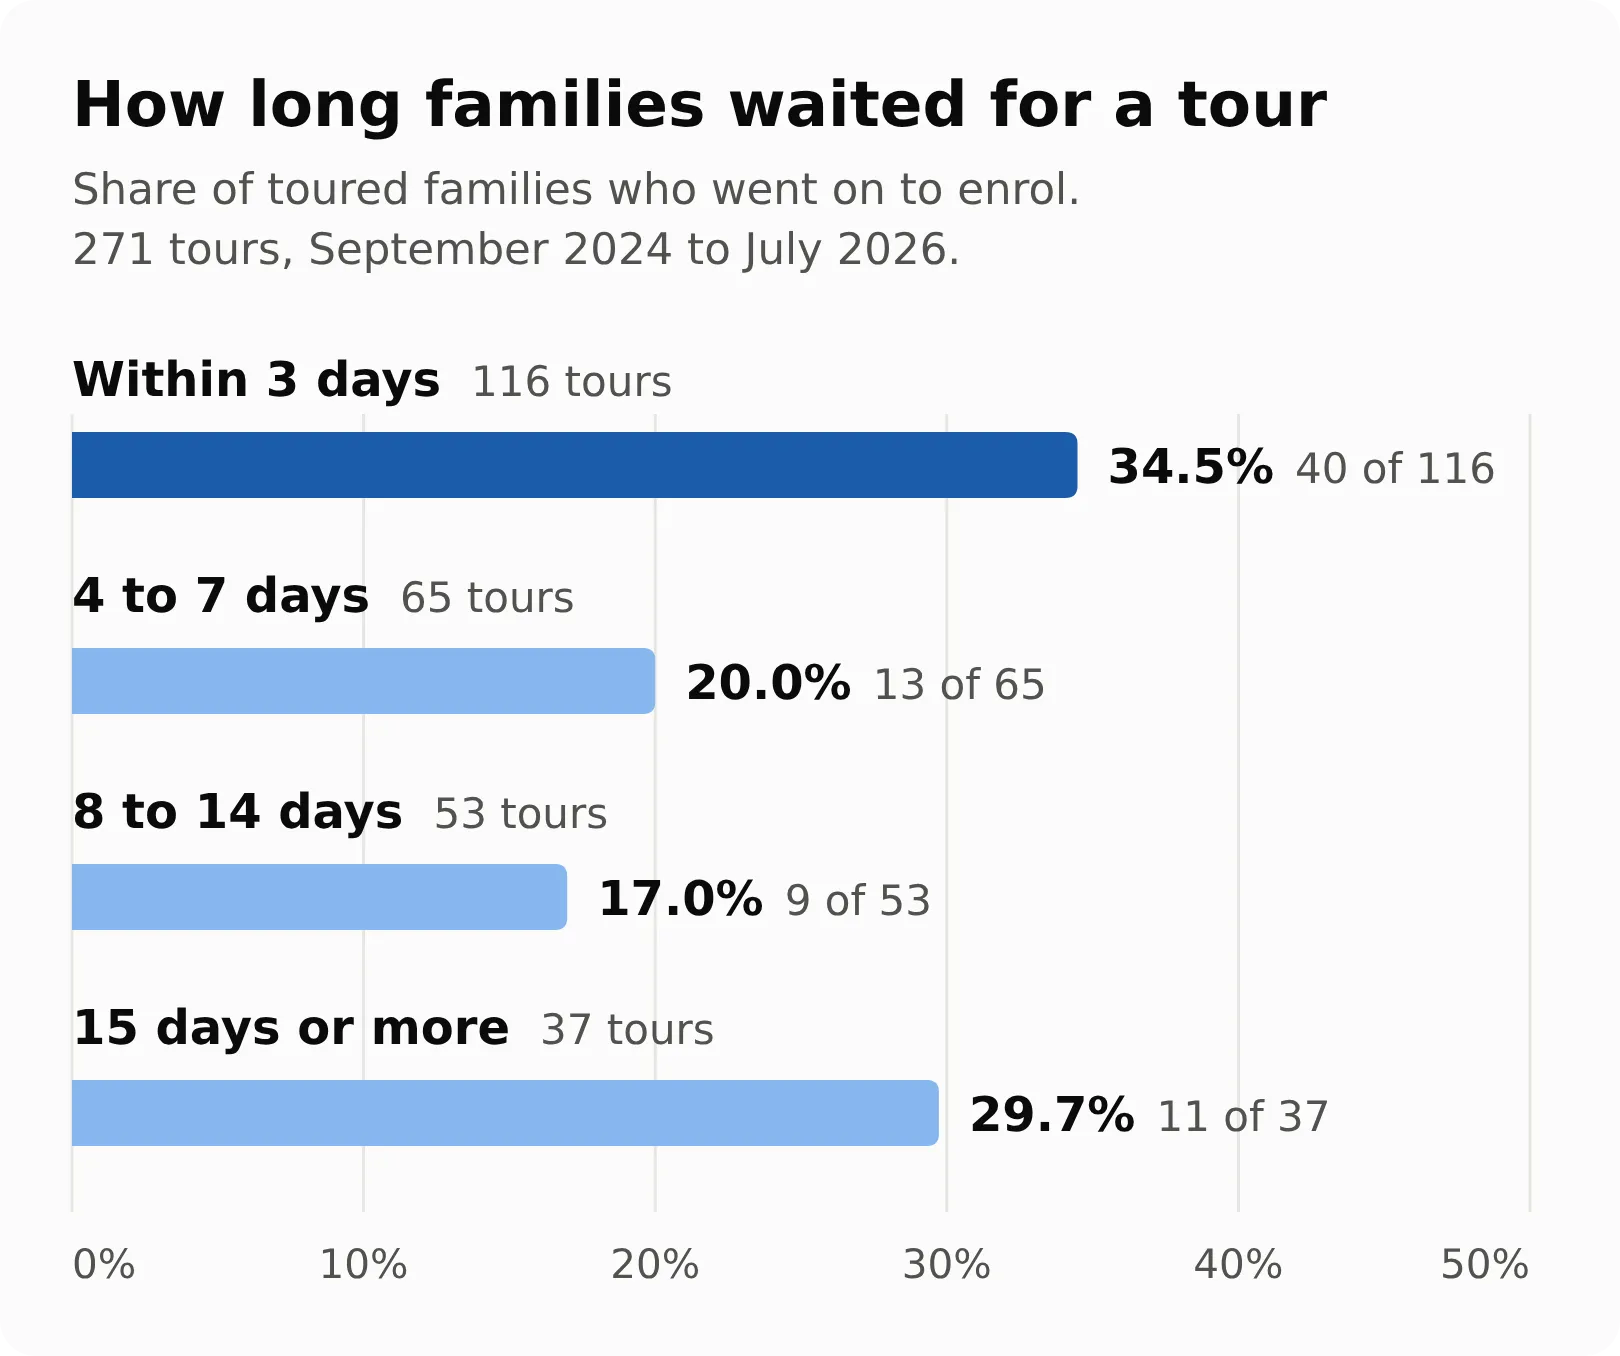
271 tours with usable dates. Every figure in this post is an aggregate.
Families who toured within three days of enquiring enrolled 34.5% of the time (40 of 116). After that it dropped to about one in five. The median family waited five days for a tour, so most of them were touring after the drop.
I had the slide written in my head before the script finished: book the tour inside three days. One number, one habit, easy to put on a whiteboard in every centre.
The last bar should have stopped me sooner. Families who waited more than a fortnight enrolled 29.7% of the time, nearly as often as the fast ones. It’s only 37 tours, so I let it slide. It was the first hint that something other than the clock was sorting these families.
Then I split it by centre
Nine centres, one brand, one owner. They are not the same business.
The two centres that close best ran 50 of the 116 fast tours, but only 36 of the 155 slow ones. Fast centres are mostly good centres. So that first bar was measuring two things at once: how quickly the tour happened, and which centre ran it.
The fix is to compare each centre with itself: its fast tours against its own slow tours, then average across the centres, weighted by how many tours each ran. I left out one centre that had run only six tours all up.
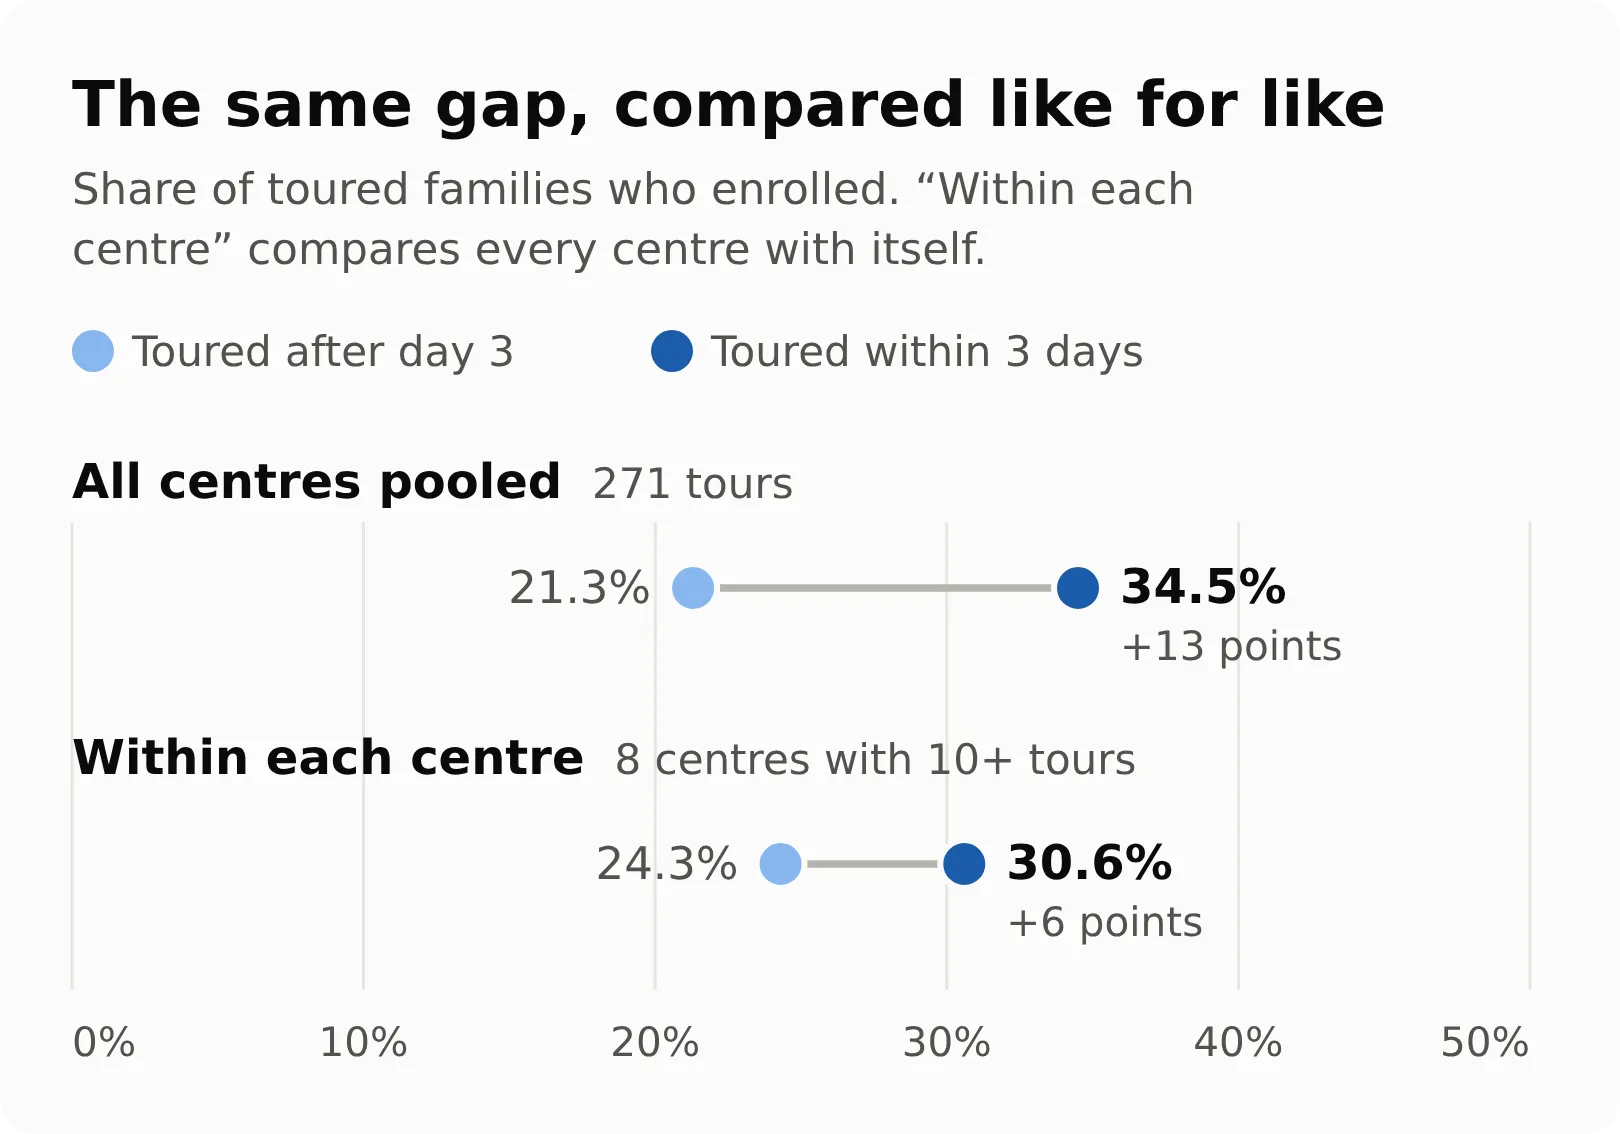
Like for like: each centre’s fast tours against its own slow ones, weighted by its number of tours.
The gap roughly halved, from 13 points to 6. At four of the nine centres, fast tours actually did worse, on numbers small enough that I wouldn’t read much into it either way.
There’s a second problem that no split can fix. The keenest families book the soonest. A parent who needs a place now takes the first slot offered; a parent who’s still shopping around takes next week’s. Some of whatever gap is left is the family, not the speed.
So booking fast is still worth doing. It still points the right way once you compare like for like, and it costs nothing. But “about a quarter better, give or take” is a different slide from “double”, and I nearly shipped the double.
Before you quote a gap between two groups, ask what else puts people into those groups. Here it was the centre, and it would have taken ten minutes to find if I’d looked before writing the slide instead of after.
What held up
The centre split turned out to be the bigger story anyway. Most of what the data had to say was about the centres.
Same brand, a six-fold spread. Of enquiries with a status, the best centre enrolled 50.5% (156 of 309). The worst enrolled 7.6% (5 of 66). Same name on the sign, same owner, same list with the same statuses.
The voicemail graveyard. For 214 enquiries, 18% of those with a status, the last thing recorded is Voicemail. The centre called back, got voicemail, and nothing was written down after that. It isn’t spread evenly. At two centres it’s 40% and 50% of the enquiries with a status; at three centres it’s none. Both voicemail-heavy centres sit in the bottom half of the close-rate table.
A full centre looks like a failing one. One centre cancelled 72 of its 127 enquiries (57%) and waitlisted another 27. Ranked on close rate, it looks weak. It isn’t failing; it’s full. Without a recorded reason for each lost lead, a centre that can’t sell and a centre with nothing left to sell look identical.
The list can’t see its own funnel. Of 340 enrolments, 261 have no tour recorded. The tours happened; nobody typed them in. Lead source, the field that says which marketing brought the family in, is filled in on 183 of 1,440 enquiries (13%). In May 2025 the whole group logged two enquiries, against 71 the month before and 41 the month after. Either the web form broke or everyone stopped typing, and the list can’t tell you which.
And the best-closing centre is the worst at logging. It put a status on 309 of its 519 enquiries, about 60%, while every other centre managed 90% or better. Its 50.5% is worked out on the rows it got around to updating, so nobody knows its real rate. A tracker that depends on people remembering to fill it in doesn’t just have gaps. Here the biggest gaps were at the busiest centre, which is also the one selling best.
What I’d take from it
- Split before you quote. A gap between two groups is only as good as your answer to “what else sorts people into these groups?”
- The league table is the finding. A six-fold spread under one brand says the lever is what happens at each centre in the days after an enquiry. The three-day window is one small piece of that.
- Never let a voicemail be the last touch. A second call or a text costs nothing next to a family you never hear from again.
- Record why a lead was lost, or a full centre and a failing one look the same.
- A system of record has to write itself. Timestamps should come from actions, not from someone remembering to change a status. Directors are running rooms full of toddlers, not databases.
Every number here comes from one export of a list kept by busy people. It can’t tell you everything. It told me enough to throw out my favourite slide.