Nobody wrote down when they called back
Since December I’ve written a monthly enrolment report for a childcare group with nine centres. Their enquiries live in a SharePoint list: a parent enquires, a row appears, and the centre director updates its status as the family moves from enquiry to tour to enrolment.
Each month a script pulls the whole list over Microsoft Graph and works out the numbers for the month: enquiries per centre, how many booked a tour, how many enrolled, where families heard about the centre, and which enquiries have gone quiet. Claude writes the summary paragraphs, and the rest becomes a branded PDF for head office, with one per centre when they want it.
The funnel was never the hard part. The question I wanted answered was simpler and more useful: when a family enquires, how long before anyone at the centre does anything about it?
The field nobody filled in
The list has no field for that. Nobody types “called back at 2:15”. But SharePoint quietly records something close.
Every edit to a list item saves a version: what changed, who changed it, and when. Graph will hand you that history, one item at a time:
GET /sites/{site-id}/lists/{list-id}/items/{item-id}/versionsSo for each enquiry, the report now reads its versions, skips the first one (that’s the row being created), and finds the first edit made by one of the centres’ own accounts. Edits from head office or from automation don’t count. The gap between the row appearing and that first centre edit is the first-touch time.
It’s a proxy. An edit isn’t a phone call. But a director who changed the row had at least opened it, and that’s more than the list could tell anyone before.
It’s also one Graph call per enquiry, so the report fetches them in batches of
50 with a pause between batches, and when Graph says slow down, it waits as long
as the Retry-After header asks.
April’s report was the first to carry it. Across the group, the median first touch was half a day.
Dead, not stale
The other list head office reads closely is stale leads: enquiries that have sat too long without moving.
The rule that made it usable was one line: ignore anything created more than 60 days ago. A lead that’s been sitting since March isn’t stale, it’s dead, and a list padded with dead leads is a list nobody reaches the bottom of. The report shows the 25 most recent and counts the rest.
The sentence printed above that list is wrong, though, twice. It says these are leads that “haven’t been touched in 14+ days, regardless of when they were created”. The code measures days since the enquiry was created, not since anyone last touched it, and it leaves out everything older than 60 days. The list does its job. The sentence describing it doesn’t match.
The nag that worked for a month
Every report also shows where families heard about the centre, and flags it when too many are marked Unknown. Here’s how that went:
- December: 21 of 21 unknown
- January: 43 of 45
- February: 24 of 54
- March: 37 of 48
- April: 39 of 51
- May: 48 of 69
One good month, then back to about three in four. I don’t know what happened in February, and the report can’t tell me. What it does show is that a report can point at a gap every month and never close it. The fix has to be in how enquiries arrive, not in a paragraph asking people to type more.
What the headline left out
Then came the May report, and its summary led with responsiveness: “Responsiveness was a real bright spot this month: the network’s median first-touch time was just 0.1 days.”
True. And the busiest centre, with 16 enquiries, had a median of four days.
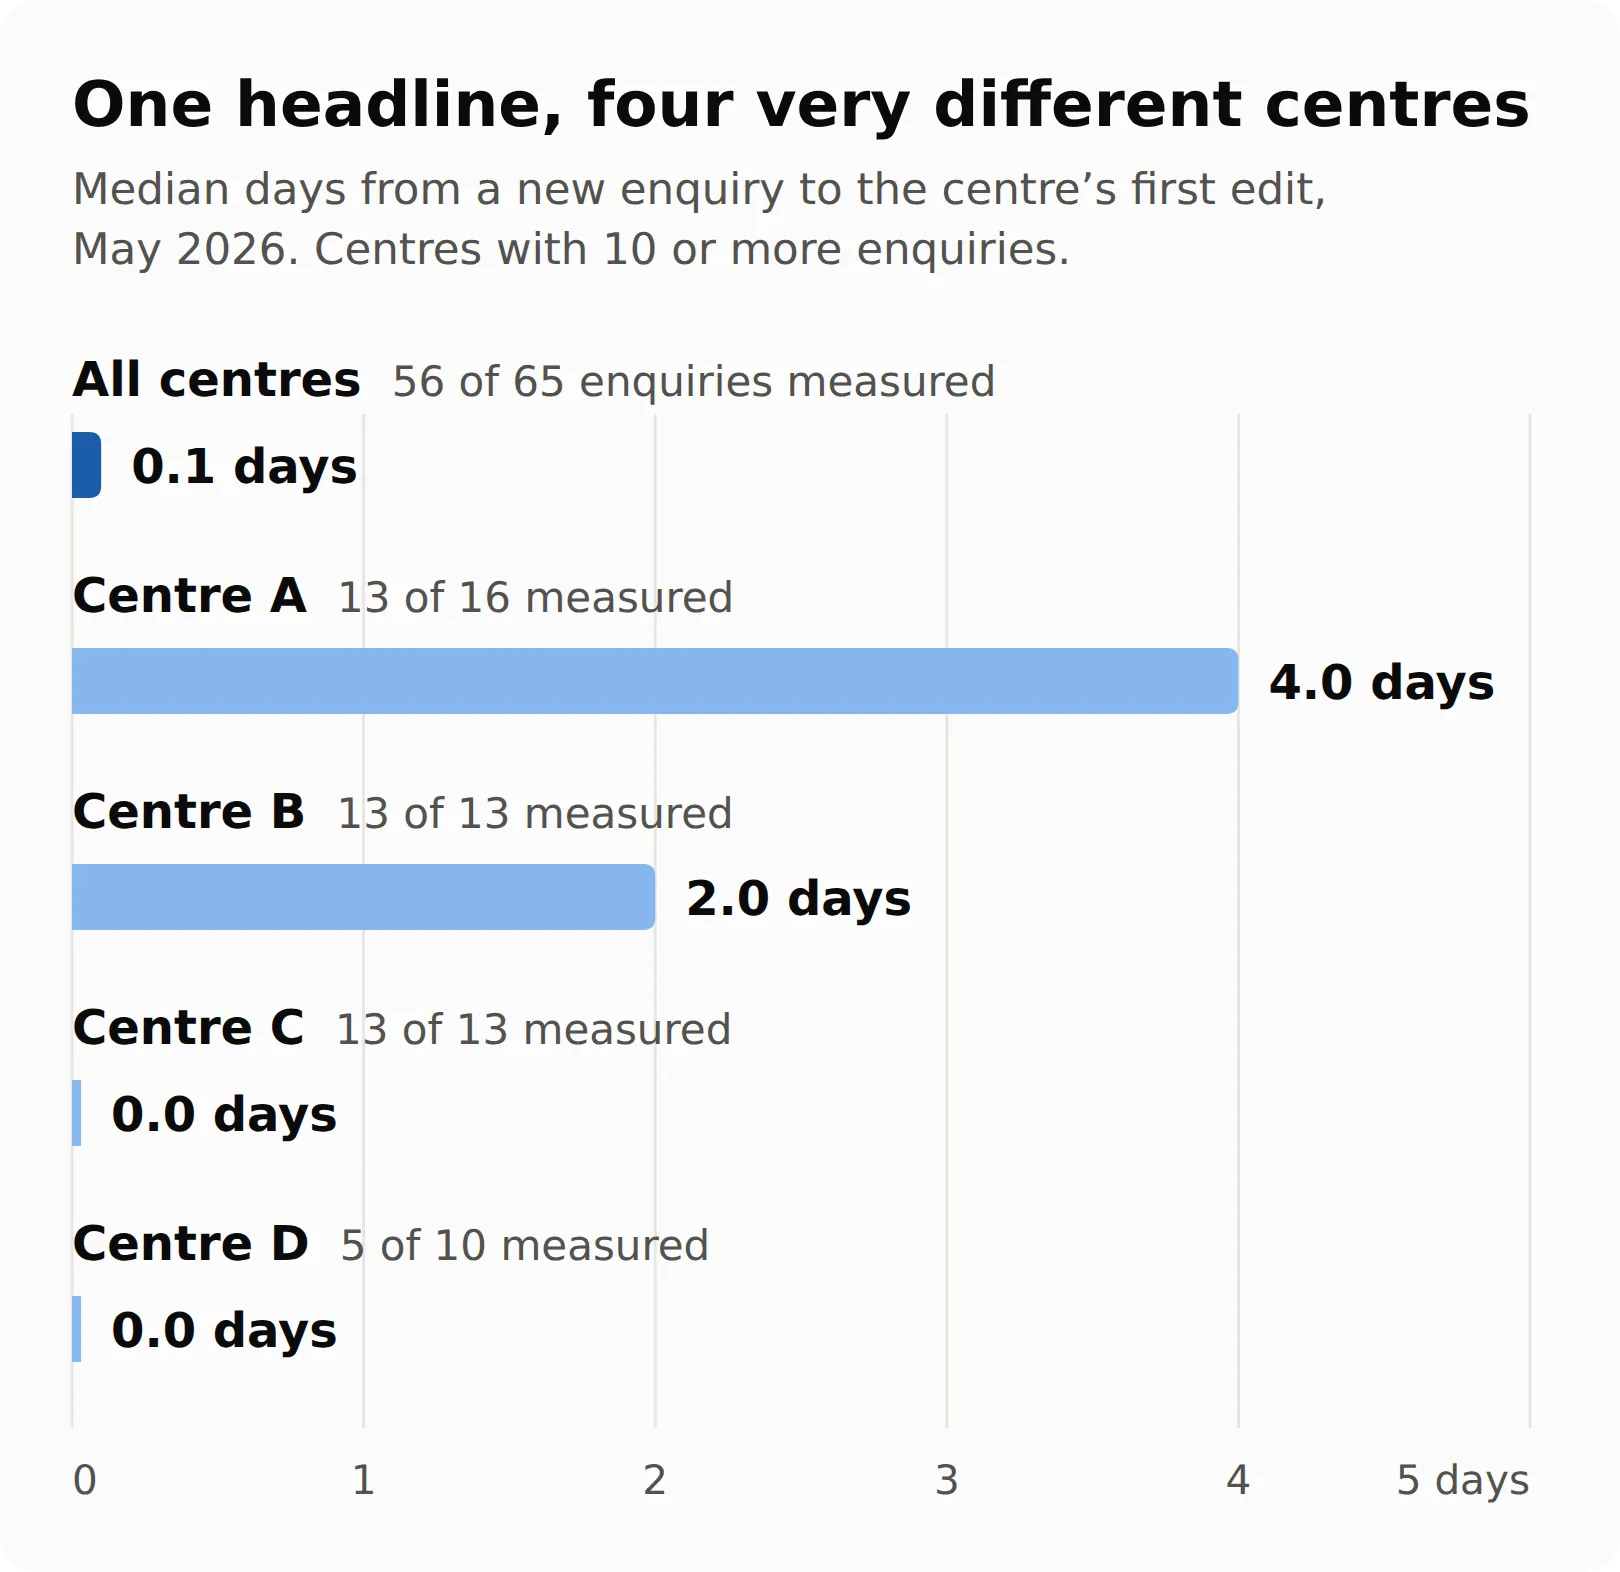
The four centres with ten or more enquiries in May. “Measured” is how many of their enquiries had a first edit from a centre account at all.
A median across the whole group is carried by whichever centres answer fastest. In May, 33 of the 56 enquiries with a first touch got it within a day, so the middle of the pile landed there. The centre taking four days, with six of its enquiries waiting three to seven days, didn’t move the headline at all.
The second blind spot is worse, and it’s in my code. A first touch only exists once a centre has edited the row. An enquiry no centre account has edited has no first-touch time, so it simply isn’t in the median. In May that was 9 of 65 enquiries. Centre D had ten enquiries; five had a centre edit, all within a day, and the summary listed it among the centres “responding on the same day enquiries arrived”. The other five had no edit from any centre account at all.
The slowest possible response is no response, and a median of response times can’t see it.
Claude didn’t do anything wrong here. I told it to be warm and constructive, to lead with the headline number and to mention responsiveness, and then I handed it a flattering headline. It did exactly what it was asked.
What the next version needs
- Count the untouched enquiries. “No centre response yet” is its own bucket, shown next to the median, not quietly dropped from it.
- Show the slowest centre beside the group number. One figure for nine centres blends good news and bad.
- Give the summary the worst number first. If one centre takes four days, that’s the sentence head office needs. Warm and constructive can come after.
- Make every sentence in the template true. If the code changes, the words above the table change with it.
The version history trick still stands. SharePoint had been recording when every centre first touched every enquiry all along; nobody had asked it. May taught me the other half: a number you can finally measure isn’t automatically a number that tells the truth. Check what it leaves out before it goes in the headline.